
 By
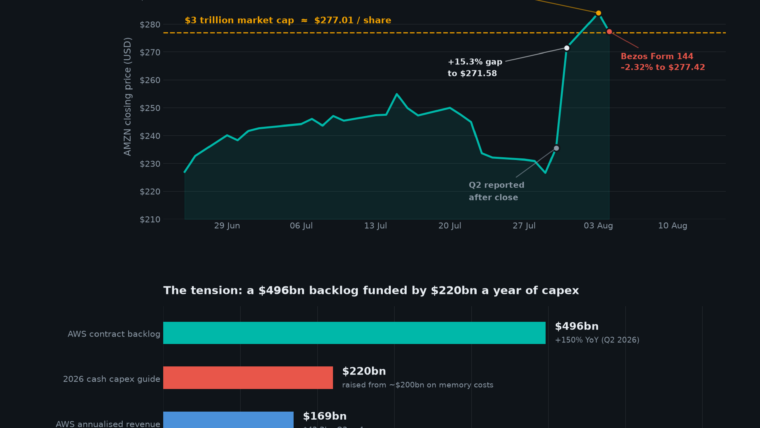
By Jeff Bezos selling $4bn of Amazon stock is not a signal about Amazon. It is a calendar entry. The Form 144 filed on Monday 3 August 2026 covers 15,000,000 shares valued at $4,073,700,000, and it executes a Rule 10b5-1 trading plan adopted on 14 November 2025 — nine months before Amazon’s Q2 print, before the $496bn AWS backlog existed as a public number, and before anyone knew there would be a $3 trillion close to sell into. Yet AMZN fell 2.32% on Tuesday 4 August to close at $277.42, according to Nasdaq, surrendering the $3 trillion badge it had held for exactly one session. A market that reprices a $3 trillion company by roughly $70bn on a mechanically pre-committed sale of 0.14% of its shares is not processing information. It is processing a headline.
That mispricing is the reason this AMZN stock prediction replaces FinanceFeeds’ June bull $370 vs bear $207 model rather than updating it: the June levels were set before Q2, before the backlog disclosure and before the capex raise. But there is a second, larger error hiding inside the same earnings report, and almost nobody has corrected for it. Amazon’s headline Q2 net income of $62.6bn and diluted EPS of $5.75 are roughly 85% a non-cash revaluation of its Anthropic stake, not operating performance. Anchor a valuation to $5.75 of quarterly EPS and you are anchoring to a number that will not repeat. Investors who fled on the Bezos filing sold the wrong risk; investors capitalising $5.75 are buying the wrong earnings. Both errors are resolvable with about ten minutes of arithmetic, and both point the same way.
Key facts
AMZN spot: $277.42, down 2.32% (−$6.60) on 4 August 2026 — Nasdaq, 4 Aug 2026
Record close $284.02 on 3 August 2026, the fifth company ever past $3trn — Nasdaq, 3 Aug 2026
Q2 net sales $200.6bn, +20% YoY; consolidated operating income $27.5bn, +43% — Amazon Q2 2026 results, 30 Jul 2026
AWS revenue $42.2bn, +37%, fastest in 18 quarters; AWS operating income $16.6bn at a 39.4% margin — Amazon Q2 2026 results
AWS backlog $496bn, up more than 150% year over year — Amazon Q2 2026 earnings call, 30 Jul 2026
2026 cash capex guidance ~$220bn, raised from ~$200bn on memory costs — Andy Jassy, Q2 2026 earnings call
Trailing free cash flow −$7.6bn, versus +$18.2bn a year earlier — Amazon Q2 2026 results
Bezos Form 144: 15m shares / $4.07bn, under a 10b5-1 plan adopted 14 Nov 2025 — SEC filing, 3 Aug 2026
What Q2 actually said — and the number most trackers got wrong
Amazon’s second quarter of 2026, reported on 30 July, put net sales at $200.6bn, up 20% from $167.7bn a year earlier, with consolidated operating income of $27.5bn, up 43%. The stock gapped 15.3% the following session, from $235.50 to $271.58.
Here is where a great deal of secondary coverage went wrong, and it is worth correcting because the error flatters the bull case. That $27.5bn is total company operating income. AWS’s segment operating income was $16.6bn. The two have been conflated repeatedly in the week since the print, which overstates the cloud division’s profitability by roughly 65%. The real AWS number is still excellent — $16.6bn is up 64% year over year, and segment margin expanded from 32.9% to 39.4% — but precision matters when you are building a target price off a multiple.
The correctly stated version is arguably more striking anyway. AWS produced 21.1% of Amazon’s revenue in Q2 but roughly 60.5% of its consolidated operating income. North America retail contributed $9.1bn of operating income and International $1.7bn. In profit terms Amazon is a cloud and advertising company with a very large logistics business attached — advertising grew 26% in the quarter — and the market has spent most of 2026 slowly agreeing.
The second correction matters more for valuation. Amazon reported Q2 net income of $62.6bn and diluted EPS of $5.75. Sitting inside that is $53.4bn of pre-tax other income “primarily from our investments in Anthropic” — a non-cash mark-to-market revaluation triggered by observable price changes in Anthropic’s financing rounds. Strip the gain out and net income falls to roughly $9.3bn. That naive subtraction actually understates the underlying business, because a related $15.9bn discrete tax charge on the Anthropic adjustment falls in the same reporting period. So the honest conclusion is neither “EPS was really $0.85” nor “EPS was $5.75”. It is that the earnings line is unusable this quarter, and operating income of $27.5bn is the only clean read on the business. Every level later in this article is built off operating income for that reason.
As Andy Jassy, President and CEO of Amazon, put it in the release: “AWS is booming, growing 36.7% year-over-year in Q2—our fastest growth in 18 quarters—and our AI and Chips businesses each eclipsed run rates of more than $25 billion.”
The Bezos filing, decoded — and who was buying it
The Form 144 is genuinely uninformative, and the reasons are all on the face of the document. Bezos is selling 15,000,000 shares against an outstanding count of roughly 10.83bn — about 0.14% of the company. The shares trace back to founder stock originally issued in July 1994. The trades run through Morgan Stanley Smith Barney on Nasdaq. Critically, the sale was pre-committed under a Rule 10b5-1 plan adopted on 14 November 2025, which is the entire legal purpose of such a plan: it fixes the schedule at a moment when the insider is presumed not to hold material non-public information, precisely so that later execution carries no signal.
Even the $4.07bn headline is an artefact. Form 144 values a proposed sale at a recent market price — here $271.58, Friday 31 July’s close — so the widely repeated “$4bn” is an arithmetic convention rather than a realised transaction value.
The market reaction was nonetheless real. Jim Cramer posted on X on 3 August: “Cant begrudge Bezos for selling $4 billion shares…but what a buzzkill.” Amazon’s $3 trillion record lasted exactly one day.
What almost no coverage paired with it is the other side of the tape on the same date. On Monday 3 August — the day the Form 144 was filed — Cathie Wood’s ARK Invest bought 73,835 AMZN shares worth roughly $20.05m across ARKK, ARKQ, ARKW, ARKF and ARKX. That is a rounding error against $4.07bn of notional supply, and it is not offered as a counter-signal of equal weight. It is offered as evidence that the same filing was read by a large discretionary manager as a non-event worth buying into. One of those readings is anchored to the mechanics of 10b5-1 plans. The other is anchored to a name.
Having tracked founder-sale reactions across the megacap complex for several years, the pattern is consistent: pre-scheduled insider sales produce a one-to-three-session drawdown that mean-reverts unless it coincides with genuine fundamental deterioration. The condition that would break that read is a Bezos sale executed outside a 10b5-1 plan, or a plan amended shortly before execution. Neither is present here.
Is AWS worth $1 trillion on its own?
The most interesting sell-side argument of the week comes from Nick Jones at BNP Paribas, who raised his AMZN price target to $355 from $345 after the print. Jones wrote that “management now sees AWS as at least double its prior multihundred-billion-dollar opportunity, with a path to becoming a $1 trillion business over time”, citing AWS backlog growth of about 36% sequentially and more than 150% year over year to $496 billion.
Test the claim with Amazon’s own numbers. AWS exited Q2 at a $169bn annualised revenue run rate and a $66.5bn annualised operating income run rate. A $1 trillion valuation against that operating income implies roughly 15× — undemanding for infrastructure compounding revenue at 37% and operating income at 64%. On that arithmetic, $1 trillion for AWS is not a stretch target at all. It is close to the value already embedded inside Amazon’s $3.0 trillion capitalisation, which implies the market is assigning retail, advertising and logistics roughly $2 trillion between them.
One distinction has been muddled all week and is worth holding onto. Jassy has separately discussed AWS reaching $1 trillion in annual revenue, which against a $169bn run rate is a vastly more distant proposition. A $1 trillion AWS valuation is a 2026–27 question. A $1 trillion AWS revenue base is a 2040s question. Conflating the two is how price targets become untethered from arithmetic.
The capex-versus-backlog tension is the whole bear case
Amazon is spending extraordinary sums to service that backlog. Jassy told the Q2 2026 earnings call: “We now believe we will spend approximately $220 billion in cash CapEx in 2026,” with the higher cost of memory pushing the figure up from a prior estimate of about $200bn. FinanceFeeds covered the capex raise and the beat that came with it at the time.
Then came the line that should shape how you model 2027: “Even at that amount, we will still not have enough capacity to meet all the demand we have in 2026, and I believe this dynamic will also be true in 2027, too.”
Read as a bull, that is demand running so far ahead of supply that revenue is capacity-gated rather than demand-gated — the most enviable constraint in enterprise technology. Read as a bear, it is a commitment to another year of capex at or above $220bn with no ceiling disclosed. The cash consequences are already visible: trailing twelve-month free cash flow has swung to negative $7.6bn from positive $18.2bn a year earlier, and trailing net purchases of property and equipment reached roughly $169bn, up 64%. AWS absorbed about $48.6bn of Q2’s $63.9bn in net additions, roughly 76% of the total.
The mechanism most bulls underweight is not the cash outflow. It is depreciation. Capex of $220bn a year converts into a depreciation wave that lands on operating income across 2027 and 2028, precisely when year-over-year comparisons get harder. Amazon’s own Q3 guidance already gestures at it: net sales of $197.0–202.0bn, implying 9–12% growth and a sharp deceleration from 20%, and operating income of $22.5–26.5bn — a midpoint below the $27.5bn Q2 just delivered. The company is guiding to a sequential decline in operating profit in the same quarter the market decided it was a $3 trillion AI compounder.
This is the same tension running through the AI infrastructure supply chain, where the picks-and-shovels names capture the capex upside without carrying the depreciation. Amazon carries both sides of that trade on one balance sheet.
Who joins the $3 trillion club next
Amazon is the fifth member, after Nvidia, Alphabet, Apple and Microsoft. Working from Nasdaq market capitalisations at the 4 August 2026 close, the standings are Nvidia at roughly $5.22trn, Alphabet $4.68trn, Apple $4.56trn, Microsoft $3.66trn and Amazon $3.00trn.
The consensus answer for the sixth member is Meta. The arithmetic disagrees. At about $1.50trn, Meta needs to roughly double — a 99.5% gain — to reach $3 trillion, and FinanceFeeds examined Meta’s own AI-spending pressure into earnings recently; doubling from here is not the base case. The genuinely closest candidate is TSMC at roughly $2.16trn, needing 38.6%. Broadcom follows at about $1.98trn, needing 51.7%. Tesla, at $1.28trn, needs 134%.
That ordering is itself informative about the AI trade. The next company through the $3 trillion door is most likely the one that fabricates the chips rather than the one that buys the most of them — a reasonable proxy for where pricing power actually sits this cycle.
Bull, base and bear — with disconfirmation triggers
Amazon’s market capitalisation stood at $3,004,527,645,481 per Nasdaq against the $277.42 close, implying roughly 10.83bn shares outstanding and putting the $3 trillion threshold at approximately $277.01 a share. The milestone the market spent a week discussing is worth about 41 cents of share price. The 52-week range is $196.00 to $287.20, and the published one-year analyst consensus target is $320.00.
All three levels below are built off operating income rather than EPS, for the reasons set out earlier. Spot implies roughly 27× Amazon’s annualised Q2 operating income run rate of about $110bn.
Bull: $395 (+42% from $277.42)
Requires 2027 operating income near $150bn — AWS contributing roughly $96bn as the $496bn backlog converts at sustained 39–40% margins, with retail and advertising adding about $54bn — capitalised at roughly 28×. This is the case in which capacity constraints are real, pricing holds, and the depreciation wave is absorbed by revenue growth rather than compressing margin. It sits inside the visible sell-side high end: BNP Paribas at $355, Benchmark at $400.
Disconfirmation trigger: AWS sequential backlog growth falling below roughly 15%, from about 36%, or Q3 AWS revenue growth printing below 33%. Either would indicate the backlog was a one-off contracting bulge rather than a durable demand curve.
Base: $320 (+15%)
2027 operating income near $135bn at about 25.6×. AWS decelerates gracefully into the high twenties, retail margin holds, and capex plateaus near $220bn rather than climbing again. This lands on the published consensus target — a coincidence worth naming rather than hiding.
Disconfirmation trigger: Q3 operating income printing outside the guided $22.5–26.5bn band in either direction. Below the low end breaks the margin assumption; above the high end means the depreciation drag is arriving later and more slowly than modelled, and this base case is too conservative.
Bear: $205 (−26%)
2027 operating income stalling near $110bn — no growth on the current run rate — at a compressed 20×, as the market reprices Amazon from AI compounder to capital-intensive infrastructure operator. The mechanism is depreciation from $220bn of annual capex landing while AWS growth normalises and memory costs stay elevated. The level sits just above the 52-week low of $196.00, roughly where the stock traded before the AI-cloud narrative re-rated it.
Disconfirmation trigger: trailing free cash flow turning positive again, or the AWS operating margin holding above 38% for two consecutive quarters. Either would show capex is being funded out of operating leverage rather than at its expense.
The near-term path is the least interesting part of this. Amazon crossed $3 trillion on a number nobody had modelled — FinanceFeeds covered the AWS backlog disclosure that drove it — and handed it back within a session on a filing that contained no information at all. Expect $277 to be retested repeatedly through Q3, because that is where round-number attention sits. The question that actually decides this stock is not whether Amazon holds a badge. It is whether $220bn a year of capex is buying a $496bn backlog at an acceptable return, and the first genuine evidence arrives with Q3 results.
Frequently asked questions
What is the AMZN stock prediction after the $3 trillion close?
This analysis sets a bull case of $395, a base case of $320 and a bear case of $205 against a spot price of $277.42 at the 4 August 2026 close. All three derive from Amazon’s annualised Q2 2026 operating income run rate of roughly $110bn rather than reported EPS, because Q2 earnings were distorted by a $53.4bn non-cash Anthropic revaluation.
Why did Amazon stock fall after hitting $3 trillion?
AMZN fell 2.32% on 4 August 2026 after a Form 144 disclosed Jeff Bezos’s plan to sell 15 million shares valued at $4.07bn. The sale was pre-scheduled under a Rule 10b5-1 plan adopted on 14 November 2025 and represents roughly 0.14% of shares outstanding, so it carries no informational content about Amazon’s prospects.
Was Amazon’s Q2 2026 EPS of $5.75 real?
Only partly. Reported net income of $62.6bn included $53.4bn of pre-tax other income, primarily a non-cash mark-to-market gain on Amazon’s Anthropic stake. Removing it leaves roughly $9.3bn, though that understates the business because a related $15.9bn discrete tax charge falls in the same period. Operating income of $27.5bn is the reliable measure of the quarter.
Is AWS worth $1 trillion as a standalone company?
Nick Jones at BNP Paribas argues AWS has a path to becoming a $1 trillion business. On AWS’s $169bn annualised revenue and $66.5bn annualised operating income run rates, a $1 trillion valuation implies about 15× operating income, which is undemanding for infrastructure growing 37%. A $1 trillion annual revenue base, which Amazon’s CEO has separately discussed, is a far more distant proposition.
How much is Amazon spending on capex in 2026?
Approximately $220bn in cash capital expenditure, raised from a prior estimate of about $200bn because of higher memory costs, according to CEO Andy Jassy on the Q2 2026 earnings call. Trailing free cash flow has consequently swung to negative $7.6bn from positive $18.2bn a year earlier.
Which company joins the $3 trillion club next?
On Nasdaq market capitalisations at the 4 August 2026 close, TSMC is closest at roughly $2.16trn, requiring a 38.6% gain. Broadcom needs 51.7% from about $1.98trn. Meta, the popular answer, would need to gain 99.5% from $1.50trn, and Tesla 134%.
This article is analysis and information only, not investment advice. Price levels are the author’s estimates derived from published company filings and market data, and may prove wrong. Conduct your own research before making any investment decision.